The UK property market’s pricing issues have been laid bare by the Property Markdown Index 2026, research collated by leading cash-buying service We Buy Any Home using data powered by Tytl.

Despite prices being on the rise after recovering from the upheaval of the Covid pandemic, there remains a major problem with the amount that houses and flats are being listed for in the first place.
Many homeowners are having to reduce the asking price, sometimes numerous times, before securing a sale.
This brings into focus the way some estate agents work and begs the question if they are best serving their customers.
The Property Markdown Index 2026 pulls back the curtain and shows clearly what is going wrong.
The Hidden Cost of Overpricing
In a buoyant housing market, in-demand properties will be snapped up in days, with buyers vying to secure the home of their dreams in the face of stiff competition.
But what’s happening at the moment is a very different picture. Properties are staying on the market for longer and a quick scan of any online listings website will highlight how many are reducing the asking price, often numerous times.
If a home sits on the market for too long, buyers may assume something is wrong and be less willing to make a strong offer. Reducing the price can help attract new interest, but it also weakens the seller’s position.
The trend for overpricing properties is having an adverse effect on those looking to move and the system is simply not working as it should.
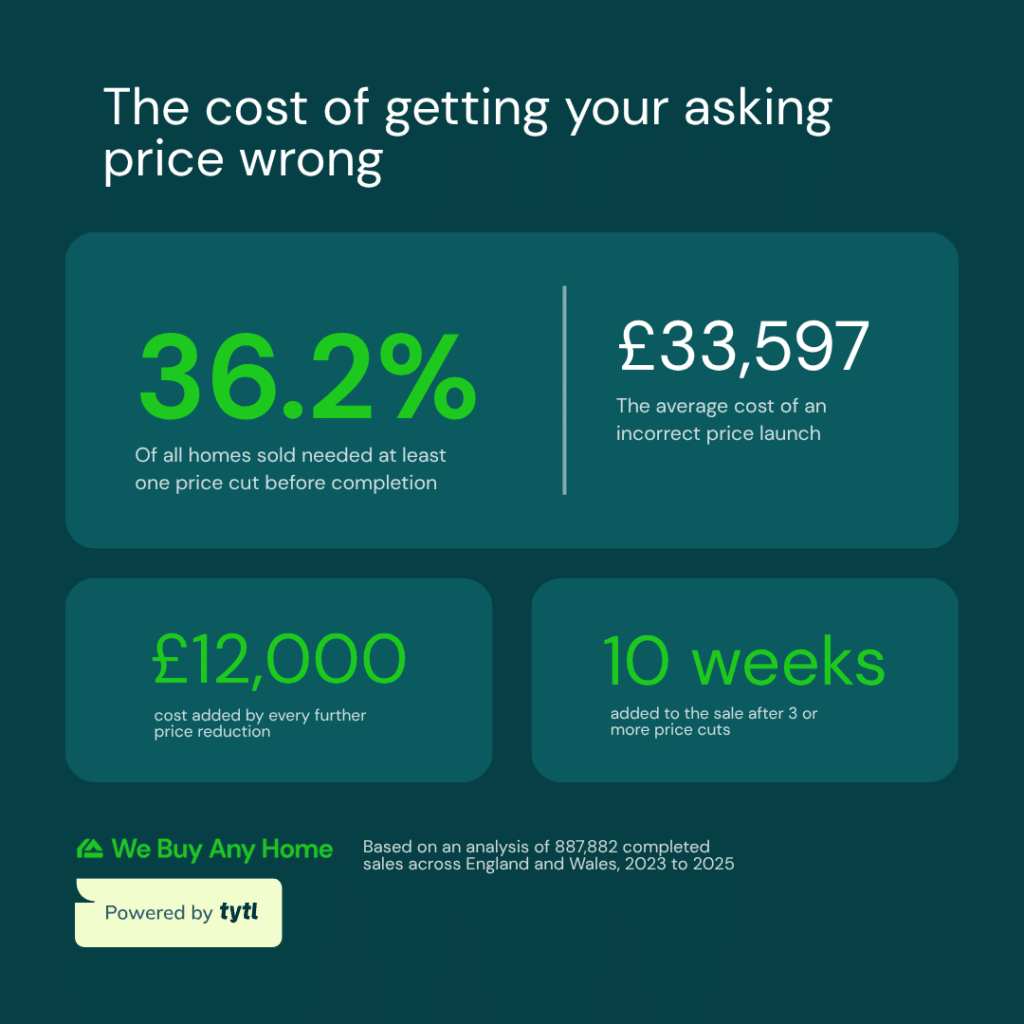
British homeowners are losing out on an average of £33,597 because their properties are being overpriced when they go on the market.
What the Data Revealed
More than a third (36.2%) of all homes put up for sale last year needed at least one price cut before keys were handed over – up from 8.1% in 2023.
The figures are drawn from analysis of 887,882 completed home sales across England and Wales from 2023 to 2025, and based on the study’s national median property value of £298,500.
Nationally, the average penalty for getting the launch price wrong is £33,597. Every additional price drop costs the seller around £12,000 and adds up to 10 weeks if a property is reduced three or more times.
This delay not only increases costs, requiring sellers to continue paying the mortgage and utility bills, but also risks chain breaks and reduced buyer interest.
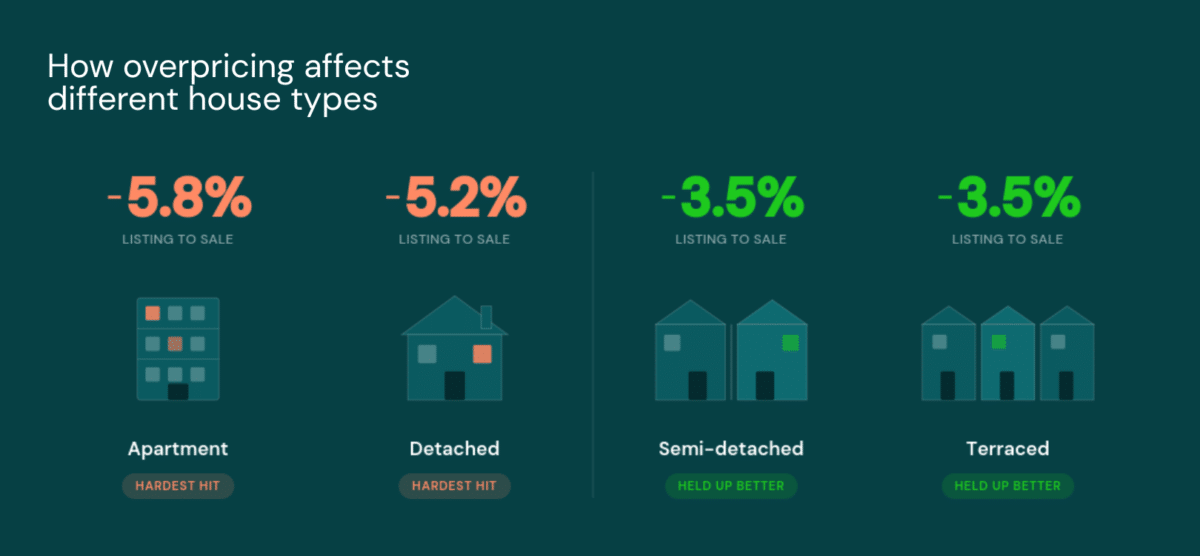
Which Property Types See the Biggest Price Reductions?
When it came to property types, apartments and detached houses fared worse, losing on average 5.8% and 5.2% from first listing to final sale price respectively.
Semi-detached and terraced houses did slightly better, both seeing 3.5% reductions.
The trend continued across all price brackets, but there were marked trends at either end of the scale.
Properties priced at £1million and above lost, on average, 6.3% during the full sales process – in real terms an average penalty of £60,000.
Meanwhile, those listed below £200,000 also saw a significant slash from the opening value – 5.8% or around £12,000.
Elliot Castle, chief executive of We Buy Any Home, said the figures should serve as a ‘wake-up call’ for sellers and agents up and down the country.
He said:
“House prices surged in 2020 and 2021 and many homeowners expected this trend to continue. But demand has softened and anyone with a home on the market at the moment knows the reality – it’s difficult out there.
“Our research shows optimistic agents are taking instructions and letting vendors see the realities of the market themselves, which often means a huge impact in how long it takes a property to sell.
“While these look like just numbers, they actually represent months of additional mortgage payments and delayed life transitions. Homes that are overpriced are languishing on the market for months longer than those that are priced correctly to begin with.”

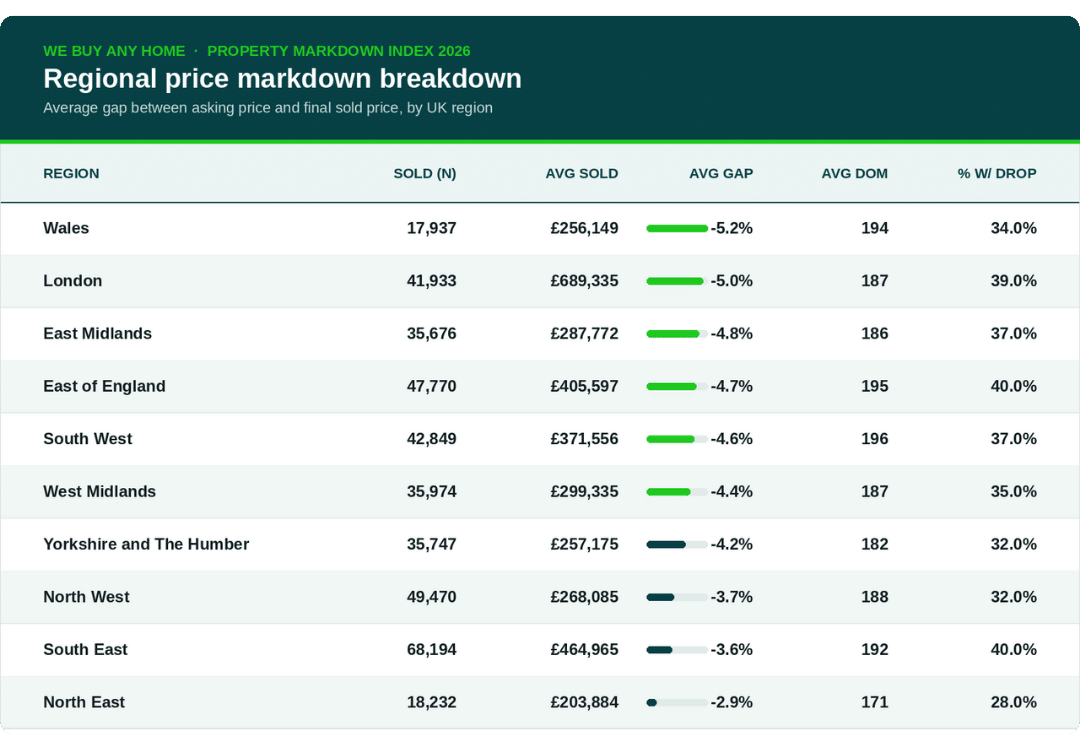
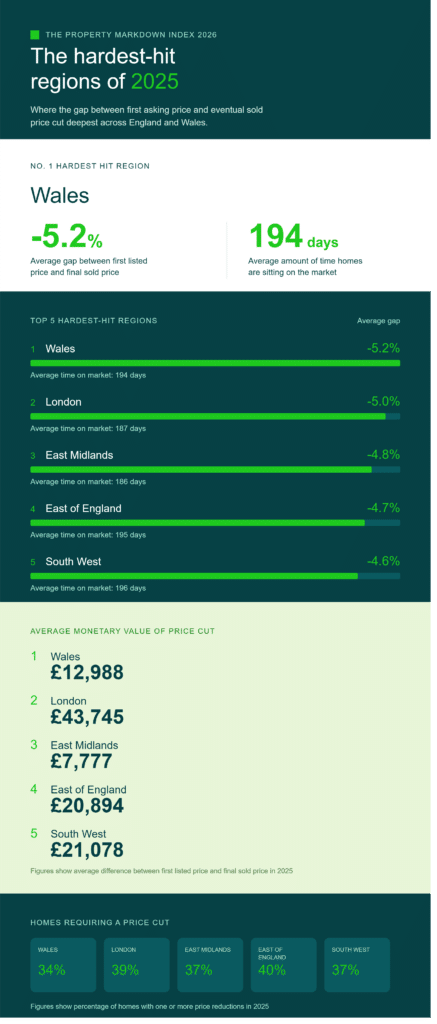
Which Regions of the UK Get Hit the Hardest?
Wales is the hardest-hit region, with an average change of -5.2% between the first listed price and final sold price in 2025, and homes sitting on the market for an average of 194 days.
There’s better news for those in the North East, which bucks the trend to stand as the most resilient market across England and Wales.
There the average discount is just -2.9%, with just 28% of homes being slashed in price before a seller is found. The average time on market is 171 days.
Meanwhile, in London around 39% of properties were reduced in value from their first listing in 2025, with a -5% gap between the original asking price and eventual sold price.
In the East Midlands 37% of homes needed a price change with an average gap of -4.8%. It’s a similar picture in the East of England where the average gap sits at -4.7%.
The South of England, with a gap of -4.6%, completes the top five.
Elliot added:
“Our research shows overpricing is now a very common, and costly, mistake.
“The first three weeks on the market are crucial. That’s when listings attract the most attention online and buyers who are waiting for something new are ready to spring into action. If you price too high, you miss that window.
“Price reductions also weaken your negotiating position. When buyers see a reduction they assume there’s further room to haggle.
“With rates of price drops quadrupling since 2023, and the amount of time properties are spending languishing on the market tripling, it’s time we said goodbye to optimistic valuations and instead listened to what’s really happening in the property market today.”
The worst suffering towns were Colyton in Devon where a 16.02% discount equated to £69,821, Church Stretton in Shropshire (-12.94%, £61,495) and Etchingham in East Sussex, (-12.22%, £255,801).
Towns Defying the Trend
But there are some success stories. Property price gaps in Blackburn, Lancashire, improved from -26.99% in 2023 to -3.26% in 2025. Banstead, Surrey from -25.42% to -1.99% and Morepeth in Northumberland -23% to -4.76%.
Ellistown in Leicestershire saw properties on the market for an average of 97 days, followed by Llangefni in Anglesey (126) and Aylesford in Kent (142).
Tom Neall, COO of Tytl said:
“This report clearly shows the real challenges being faced on the property market, but there’s also subtler problems that overpricing creates.
“When a property lingers buyers grow suspicious and perceived value drops. The home becomes stale in the eyes of the market and no amount of subsequent price cutting fully restores that initial excitement a new listing generates.
“The first few weeks matter enormously because if you get the price right from day one the market responds. If you get it wrong, you may spend months paying for that mistake.”
Methodology
Methodology – The data has been collated using three Excel extracts of UK property listings, one per calendar year of first listing date (2023, 2024, 2025). Each record covers postcode, region, property type, bedrooms, first listed price, last marketed price, last sold price, dates of listing and sale, and the number of price change events during the campaign.
Properties with implausible prices (below £10,000 or above £50m), and properties with missing sold dates or sold prices were excluded. All year-on-year comparisons in this report use the calendar year of sale completion, not the year of listing. Completed sales recorded as 2023 are lower in volume than 2024 or 2025 because the source files do not fully capture listings that started before mid-2023.